Crowdsourcing Knowledge for Representation: Interactive Learning and Engagement with Collections Using Zooniverse’s Mapping Historic Skies
JESSICA BRODEFRANK, MA; SAMANTHA BLICKHAN, PhD; BECKY ROTHER; L. CLIFTON JOHNSON, PhD
Theory and Practice, Vol. 3, 2020
Abstract This paper will describe the process of creating Mapping Historic Skies, a project which aims to crowdsource the identification of constellations from the Adler Planetarium’s collection of over 4,000 historical star maps, globes, and works on paper. This project evolved from a desire to allow guests to interact one-on-one with historical collections, to show a more diverse arrangement of collections items, and to display the Zooniverse team prominently on the Adler floor. The project is a collaboration between members of the Adler Collections department and Zooniverse team members from the Adler’s department of Citizen Science. Below is described the process of developing, prototyping and testing the project using the Zooniverse Project Builder (https://www.zooniverse.org/lab) and mobile app[1], as well as the challenges of designing project workflows to be part of an in-museum exhibit, as compared with workflows hosted on an online platform. The project is included as an interactive touchscreen in the Adler’s Chicago’s Night Sky exhibit, opened November 2019.
Keywords Citizen science; Representation; Crowdsourcing; Outreach; Exhibits
About the Authors Jessica BrodeFrank is the Digital Collections Access Manager at the Adler Planetarium. She is currently pursuing a Ph.D. in Digital Humanities at the University of London looking at museum database structures, implicit bias, and the use of folksonomic tagging.
Dr. Samantha Blickhan is the Humanities Research Lead for Zooniverse and IMLS Postdoctoral Fellow at the Adler Planetarium in Chicago. Her role includes individual consultation with Project Builders as well as leading workshops to communicate best practices and help teams integrate crowdsourcing into their research projects.
Becky Rother is the lead designer for Zooniverse, based in the Adler Planetarium in Chicago. In this role, she works with research teams to create bespoke projects suited to a specific research goal in addition to leading design efforts on zooniverse.org.
Dr. L. Clifton Johnson is a jointly appointed Zooniverse and CIERA Postdoctoral Fellow at the Adler Planetarium and Northwestern University in Chicago. He is an astronomer who studies star formation and nearby galaxies, and serves as Science Lead at the Zooniverse.
Introduction
The Adler Planetarium is a unique institution, in that it not only serves the city of Chicago, but also a worldwide community. This international reach is thanks in large part to our involvement with the Zooniverse citizen science platform. A partnership between the Adler and Oxford University, Zooniverse is the world-leading platform for online crowdsourced research. Zooniverse began in 2007 as a single project, Galaxy Zoo,[2] but now comprises over 90 currently-active projects and more than 1.7 million registered volunteers in 234 countries around the world.[3] To mitigate inaccuracy from volunteer-generated data, Zooniverse projects feature blind classification: to participate in a project, volunteers engage in a task or series of tasks independently of other users and the responses are aggregated together for consensus. The resulting data from these projects has been used in more than 250 peer-reviewed publications to date.[4] In 2015, the Zooniverse launched the Project Builder,[5] a do-it-yourself tool that allows anyone to build a crowdsourcing project on the Zooniverse platform for free.[6]
As Zooniverse has grown, the Adler has sought a way to use the platform to invite members of the public to engage with curatorial and collections work being done with its collection of books, maps, and objects. One such project idea came out of a multi-year digitization project funded by the National Endowment for the Humanities (NEH) (Grant #PW-51687-14). Collections team members at the Adler were able to digitize the institution’s collection of over 4,000 historical constellation maps and depictions covering six hundred years, featuring figurative representations of constellations from around the world.
The Adler’s exhibitions that are stronger in historical content tend to focus mainly on the development of Western astronomy from the Middle Ages to the present day. To begin mitigating this exclusion of other cultures, and in recognition that the collections themselves housed more representation than was shown, the initial concept for this project was to use these images to show how the constellations we know today have been depicted in art over time and throughout various cultures. The Western tradition of celestial cartography developed on the strength of varied contributions, building upon astronomical knowledge originating in Mesopotamia and Ancient Greece that was kept and expanded during the Middle Ages by Islamic astronomers. This project highlights that constellations in this tradition have been represented in varied forms, reflecting different cultural contexts where star maps and globes are produced.
The biggest challenge was the sheer size of the dataset.
The biggest challenge to this goal was the sheer size of the dataset. With only one curator and one full-time digital collections staff member, an undertaking of this size would have spanned years. Realizing that crowdsourcing might be a viable option for such an undertaking, and recognizing the knowledge base of the Zooniverse participant pool as an asset for representing these various cultural contexts and contributions, the Collections team reached out to the Zooniverse team, based in the Adler’s Citizen Science department for help. The result is a Zooniverse project that combines a traditional, online crowdsourcing project with an in-gallery interactive (adapted from the Zooniverse mobile app) displayed on the Adler floor: Mapping Historic Skies.
The core idea behind the Adler’s newest exhibition, Chicago’s Night Sky, is that the sky connects us all as humans. Our project, Mapping Historic Skies, provides our guests with a unique opportunity to participate in the creation of a curatorial research tool while engaging with cultural artifacts that express an enduring connection to the sky that is both historical and global. As Adler Planetarium founder Max Adler said at the institution’s opening in 1930: “We dwell too little upon the truth that under the heavens everything is interrelated, even as each of us to the other.”[7] This is a message we are proud to continue to share.
History of the Project
In 2014, the Adler Collections team proposed an early version of the current project to the NEH for funding. It was called Digital Historic Skies and the goal was to create an interactive mobile application that would teach the general public about art, history, and science in cultures throughout the world through the comparison of historical celestial maps and images of the current night sky. The ultimate goal was to create an app for smartphones that would use GPS to display associated images from the Adler’s celestial cartography collection, allowing users to look at any region of the sky and easily access the relevant historical and cultural constellation depictions. The Digital Historic Skies proposal received funding from the NEH for prototyping research (Grant #HD-51957-14), and resulted in a white paper,[8] which offered suggestions for continued development of the project and set in motion the actions which ultimately formed the foundation for the current effort.
An obstacle for that specific project was the small team size. Early planning for Digital Historic Skies stalled for the restructuring of tasks in order to make the goals achievable for such a small team. The original proposal did not foresee the amount of time needed to comb through the celestial cartography collection: not only did each image need to be catalogued, but every individual constellation within each image needed to be identified, cropped out of the original image, and formatted for use within the app. Though there is still hope to have an end product of the type imagined in the original Digital Historic Skies proposal, it is no longer listed as an immediate outcome. The focus is now on smaller-scale, achievable goals, detailed below, which can then be used to support long-term project development and user engagement.
Online volunteers and visitors to the exhibit are helping with real research and are participating as co-creators towards a repository of public knowledge.
Through conversations between the Collections department and the Zooniverse team at the Adler, the newest version of the project emerged, entitled Mapping Historic Skies. The project consists of an interactive crowdsourcing project built using the Zooniverse Project Builder. The end goal is to narrow down the large Adler dataset into images of single, identified constellations. The interactive workflows on Zooniverse break down the identification of constellations in the Adler’s historical star maps into simple tasks achievable by anyone without requiring previous knowledge of astronomy. These tasks were determined through prototyping with museum guests on the Adler museum floor to test barriers to entry. The intended audience for this interactive is visitors to the Adler’s upcoming Chicago’s Night Sky exhibit, as well as online participants from all over the world, although these two groups of volunteers will have different types of tasks in which they can participate. In time, the resulting identifications will be added to a database of constellations, meaning online volunteers as well as visitors to the exhibit who participate in Mapping Historic Skies are helping with real research and are participating as co-creators towards a repository of public knowledge. The creation of the database will be part of the next project phase.
Interactive Workflows in Mapping Historic Skies
Before starting the design and development process, the Collections and Zooniverse teams worked with the Adler’s Guest Experience team to create internal project objectives to direct the development of the in-museum interactive.
Mapping Historic Skies Internal Project Objectives:
- Connect within the institution to the people best suited to each role. Cross-departmental collaboration is key in innovative digital projects.
- Assess results of trial runs and utilize advice to advance your prototype. Test it, test it, test it, then workshop and try again.
- Visitor participation in trials will lead to a better experience for guests on the final format. Interactive citizen science allows visitors to take ownership of the collection in a very real and interactive way.
The project was divided into three workflows: image sorting, image segmentation, and constellation identification. Many examples in the Adler collection feature multiple constellations within a single image. For example, figure 1 below, from Rev. Richard Rouse Bloxam’s Urania’s mirror: or, A view of the heavens, engraved by Sidney Hall in 1825, highlights four different constellations: Sagittarius, the Archer; Corona Australis, the Southern Crown; Microscopium, the Microscope; and Telescopium, the Telescope, respectively.

To facilitate the identification of individual constellations within an example like the one above, the multi-constellation images first need to be separated from the full dataset. This workflow is available on MappingHistoricSkies.org as well as the Zooniverse mobile app; but most importantly, this is the workflow set to be completed in an onsite interactive in the Adler’s Chicago Night Sky exhibit.
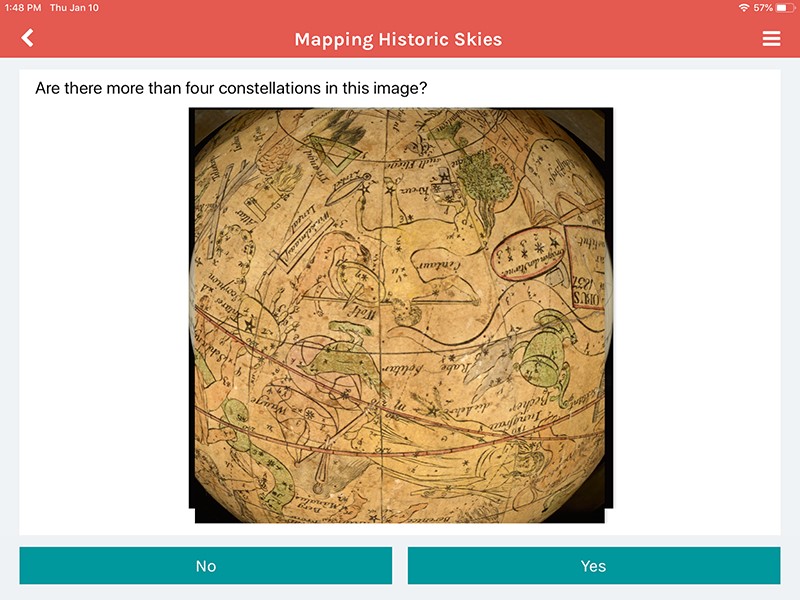
Originally, an image sorting workflow was envisioned. We believed it would be an easy entry point for guests with little astronomy knowledge, or who held any other perceived barriers to participation. They would be shown an image from the Adler collection and asked if the image depicts more than four constellations with the option to respond “Yes” or “No.” Multiple volunteers would answer this question for each image, and the answers would be aggregated together for consensus. Figure 2 shows what this workflow looked like on the Zooniverse iPad app. The images that received a “No” consensus, meaning there are four constellations or fewer in the image, were meant to then be added to the segmentation workflow.
This workflow, however, was deemed irrelevant. When sorting images in to this workflow it was clear to Adler staff which images had four or more constellations; so why was this needed? It amounted to “busy work” for guests and did not provide the opportunity for meaningful engagement. If our goal was to allow guests to see the variety of constellations depictions across times and throughout cultures, this was not providing that connection. We discontinued this workflow, opting to do this work internally, leaving us with a segmentation workflow in the exhibit and an identification workflow online.
The in-exhibit workflow is presented on a 10.5-inch iPad Pro using a modified version of the Zooniverse mobile app, shown in figure 3. Modifications to the Zooniverse app that were needed to run this project in a public gallery include the inability to navigate away from the Mapping Historic Skies project and a modified tutorial. Testing on the floor also showed that guests were able to better see our images while using a “dark mode.” These features have since been added to the Zooniverse Project builder as an option for any other researcher to use with a mobile-friendly project. While the Zooniverse codebase is open source and freely available on GitHub, customization for the “Museum Mode” version of the mobile app was available to the project team due to the Adler’s physical proximity to Zooniverse developers. Thanks to this project, “Museum Mode” is now available to all project owners who request it.
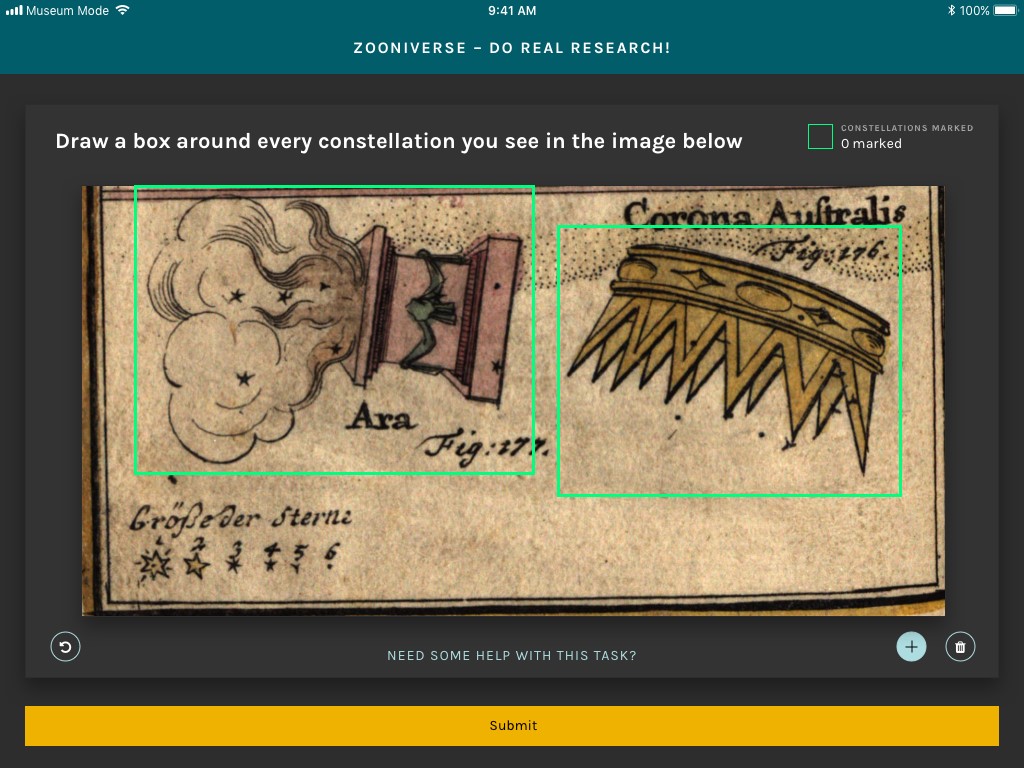
In the segmentation workflow, participants are invited to draw boxes around individual constellations within an image, or ‘subject’ in Zooniverse terms. The boxes drawn by multiple volunteers (typically >150 classifications per subject) are aggregated and merged into a set of consensus boxes, and these results are used to divide multi-constellation subjects so that individual constellations can be highlighted and cropped for subsequent use.
Once the multi-constellation images are subdivided, the identification of individual constellations is performed by Zooniverse volunteers using a second workflow on MappingHistoricSkies.org. Volunteers are shown an image of a single constellation and asked if they know the name of the constellation depicted in the image. If volunteers know the answer, they can type in the name of the constellation manually and submit their response; more than half of classifications use this method of submission. If not, they can answer a series of questions based on the visual characteristics of the artistic depiction of the constellation. These questions are meant to guide volunteers through the process of identifying the constellation using a decision tree. The initial questions are quite general—“Choose the option that best represents the figure in the image: Human, Animal, or Object,”—but narrow in specificity as the volunteer answers additional questions, culminating in either a recommendation of a single constellation name, or a choice between two or three similar constellations, e.g. “A ram with a tail: Capricorn” or “A ram without a tail: Aries”. The constellation identifications for each image (typically 50 classifications per subject) are aggregated into a consensus constellation result; questionable cases with low agreement among volunteers are reviewed by a research team member for verification.
The decision to separate the workflows between different audiences for the project was based on available technical infrastructure as well as a desire to provide a positive experience for exhibit guests and online visitors. The segmentation workflow was selected to be used onsite as a featured interactive in the Adler’s Chicago’s Night Sky exhibit. It is not possible to hide this workflow from online visitors to MappingHistoricSkies.org, but the project includes instructions for online volunteers to guide them to the identification workflow, rather than the segmentation workflow. Even so, many online volunteers continue to participate in the segmentation workflow, as they enjoy the task and subject matter. Because of this, we have raised the required number of classifications for each image, to ensure that the exhibit workflow will be available for guest participation during the exhibit’s run.
Online volunteers have already classified the 671 constellation images that were initially uploaded to the identification workflow.
The constellation identification workflow is only available at MappingHistoricSkies.org, as this type of decision tree workflow is not currently compatible with the mobile app. Ideally, visitors to the exhibit who are interested in the project can go home and continue to participate in the long term. However, there are many volunteers who participate in the project without ever having visited the Adler, and the online community on Zooniverse is incredibly dedicated to helping research teams. As of March 2020, four months after the project launched, online volunteers have already fully classified the 671 constellation images that were initially uploaded to the identification workflow. A second dataset of 490 images was added to the project in late February, and at the time of this writing they are quickly nearing completion.
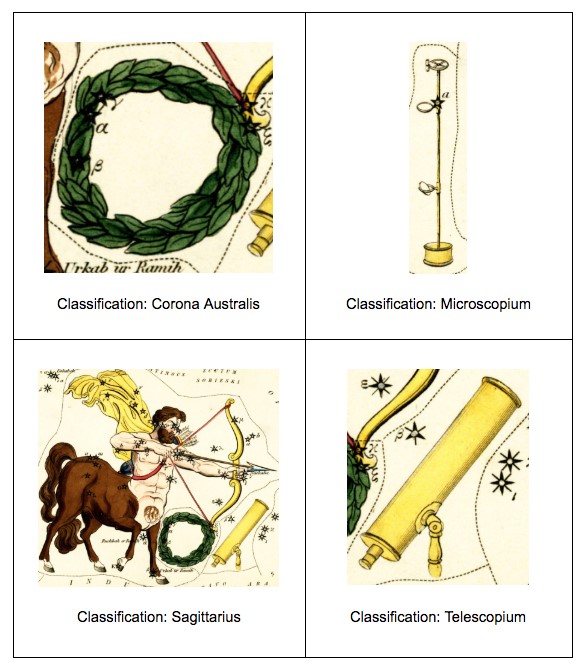
The full project data pipeline is as follows: images are uploaded to the Mapping Historic Skies segmentation workflow, where volunteers draw bounding boxes around individual constellations. Single constellation images are constructed via offline data processing and aggregation, and the resulting subjects are uploaded to the online workflow for identification. For example, the image of Sagittarius from figure 1 would ultimately become four separate images, each classified as an individual constellation, shown in figure 4. The four separate images are then fed through the identification workflow online and classified by name, as shown below.
Transferring Online Citizen Science into Museum Exhibits
Though the Zooniverse team had previously worked on many similar image segmentation and identification projects, this one was profoundly different. Instead of taking place solely on the Zooniverse website or mobile app, Mapping Historic Skies includes volunteer participation from within a gallery setting, which raised some unique challenges for the team. For example, the in-museum iteration of the project would need to welcome visitors and pique their curiosity while also communicating that this is a real research project and not merely an exploratory interactive. The interactive also had to fit into the exhibition narrative. Happily, the Zooniverse team had experience designing in-exhibit Zooniverse experiences.
During the design of this project, our team looked at the MicroPlants[9] project, which similarly features an online project with tools designed by the Zooniverse team as well as an interactive kiosk hosted at the Field Museum in Chicago. In their findings, the MicroPlants team reported that ultimately the data provided by both online participants and kiosk visitors was comparable with data provided by experts, but noted “participant interaction with the kiosk is very different from their interaction with the online platform” and “[i]n the exhibit, participant interaction is potentially limited by time, interest, and other waiting people”.[10] The MicroPlants team at the Field Museum is not the first to integrate online crowdsourcing into their exhibitions; the online crowdsourcing hub SciStarter offers a ‘kiosk’ for museums and other public spaces which allows institutional visitors to participate in online citizen science projects by choosing from a curated list.[11] However, the MicroPlants example was particularly relevant to the design of Mapping Historic Skies as it featured a single project which received classifications from museum visitors as well as online volunteers, and the team was able to study the results received from both platforms. The Mapping Historic Skies project does not present the same task to online and in-museum volunteers, but it was still useful to look at the research produced by the MicroPlants team when designing for both these experiences, particularly in regard to data quality and participant interaction.
Testing
As the Adler Collections team prepared to load the content into the Zooniverse platform by resizing images and identifying which objects would work well, the Zooniverse team created a beta version of the project workflow. A group assembled from the Adler’s Collections, Zooniverse, and Guest Experience departments began asking guests whether an image depicted a single constellation (if so, swipe left), or multiple constellations (swipe right). At an after-hours event for members of the Adler Planetarium, we took the beta prototype onto the floor and tested it with guests to judge initial reactions and enthusiasm for the task. Comparing those results to the known enthusiasm for Zooniverse projects online helped to shape the project’s future steps.
Guests found the activity to be self-explanatory, easy to follow, and intuitive.
The initial reactions on the floor were reassuring. Our guests found the activity to be self-explanatory, easy to follow, and intuitive. Many expressed a profound interest in being able to interact with museum objects in the digital space and at a more personal level than they could within the display cases on the museum floor. However, the original beta test had some limitations: the prototype only tested the Yes/No swipe workflow, meaning the responses were limited to opinions on the simplest task, not more challenging ones like segmenting images (drawing boxes) or identifying constellations. We held the testing at a Members’ Night, meaning that the responses came from our most excited and loyal audience. The next step for the team was to create a more in-depth prototype that could be used not only at future Adler events, but also in tests on the museum floor with everyday guests.
The goal of these prototypes and beta tests were to work out what, if any, difference there might be between the reactions of our in-gallery guests to crowdsourcing projects and the online members of the Zooniverse community. We also wanted to determine simple but still unknown answers to questions such as:
- How long will a guest participate in this interactive before moving on?
- Is there one task (segmentation, identification, etc.) that is more popular among guests than others?
- Are each of these individual workflows presented in a way to allow for an intuitive experience for our guests?
Testing on the museum floor over a three-month period provided our team with solid next steps. We had quickly realized that our simplest Yes/No swipe workflow was the most well-received. However, it did not give us the most useful data, as the Adler catalog data already listed which images featured single vs. multiple constellations. With this in mind, we chose to instead focus on the segmentation workflow for more meaningful engagement. As we prototyped the segmentation workflow with museum guests, “Draw a box around each individual constellation in the image,” we noticed that there was a certain point at which guests would become overwhelmed by the task: most guests were willing to draw boxes around five constellations before giving up and abandoning the task. Based on this feedback, any images containing more than five constellations would be cropped down by the Collections staff before being sent to the segmentation workflow.
As we tested on the floor we realized that many of our guests were too intimidated to try either workflow if staff members were standing next to or holding the iPads and observing guests. There was a perception that the members of staff facilitating these tests were ‘experts,’ which made many of our guests feel wary of participating. We often heard them vocally expressing concerns of being “wrong” or questioning their knowledge of constellations. Many were convinced they did not have the skill set or knowledge required to complete these tasks. Notably, children under the age of 10 did not seem to have this bias and would immediately jump into the tasks without hesitation. It was older teenagers and adults who required reassurance, and even then, would often leave the testing without completing a classification due to fear of being wrong. With that in mind, we set up tests in which the iPads were left on a table and observed by staff from afar, more closely simulating the final gallery experience.
Outcomes and Continued Development
Running these tests on the museum floor helped us re-evaluate our question and task design. Originally, we planned for the identification workflow that would provide guests with a series of questions until they worked out which constellation they were viewing to be included in the Chicago’s Night Sky exhibit. However, as noted above in the discussion of the workflow design process, the Zooniverse mobile app does not yet have the functionality required to present a series of yes/no swipe options based on a single image. The desktop version of the Project Builder does, however, include this capability, which fueled the decision to offer that workflow to online volunteers on the Zooniverse website. Furthermore, since our prototyping found the segmentation workflow to be the most successful with museum guests, we decided to offer other tasks on Zooniverse.org to encourage visitors to continue to engage with the exhibit at home. The Adler’s core promise is to “Spark Real Connections,” seeking to invite guests to explore what they learn at the museum when they return home, and an online component of the exhibit met this requirement.
The testing process also taught us that it is crucial to provide contextual information about why we need guest participation in this project. All online Zooniverse projects feature an “About” page, which allows teams to explain the research and motivations behind their project, and an in-museum crowdsourcing experience similarly merits research justification and contextualization. During testing, we found that guests were more engaged and willing to participate when they were told 1) why we were asking them to take part and 2) that they were helping with real, ongoing research. Since the in-exhibit interactive is not supervised by staff, we rely on exhibition text and design to provide this information to guests.
After engaging with the digital images on the interactive, many then wished to view the objects on the museum floor.
Many guests who participated in testing also expressed an increased interest in the Adler Collections. After engaging with the digital images on the interactive, many then wished to view the objects on the museum floor. This feedback helped with the Chicago’s Night Sky exhibition planning, putting an emphasis on designing the space so these objects are within eyeline or in close proximity to the interactive.
As the exhibition launched in November 2019, we similarly set the online exclusive workflow to launch at the same time. At the time of publication for this paper, we have had both onsite and online workflows running for two months. In that time, we have been able to use Zooniverse.org statistics to track how the interactions are going for both projects.
For classification through the 15th of March, 2020, over 33,000 classifications have been made on our segmentation workflow, however, only 7,000 of those have been made onsite, through the in-exhibit iPads. In that same amount of time the Adler had about 60,000 guests come to the Adler, so there appears to be less engagement from our onsite audience, than from the smaller dedicated group of classifiers on the Zooniverse platform.

We were also able to show why we needed to design the onsite project differently than the online only workflow. After uploading a data set of 671 individual constellation depictions to the Identify Constellations workflow on MappingHistoricSkies.org, we saw over double the engagement with online as we did onsite; within half the time. Between November 16, 2019 and December 16, 2019, we had 34,288 classifications completed online, completing the classification required for all 671 uploaded images.

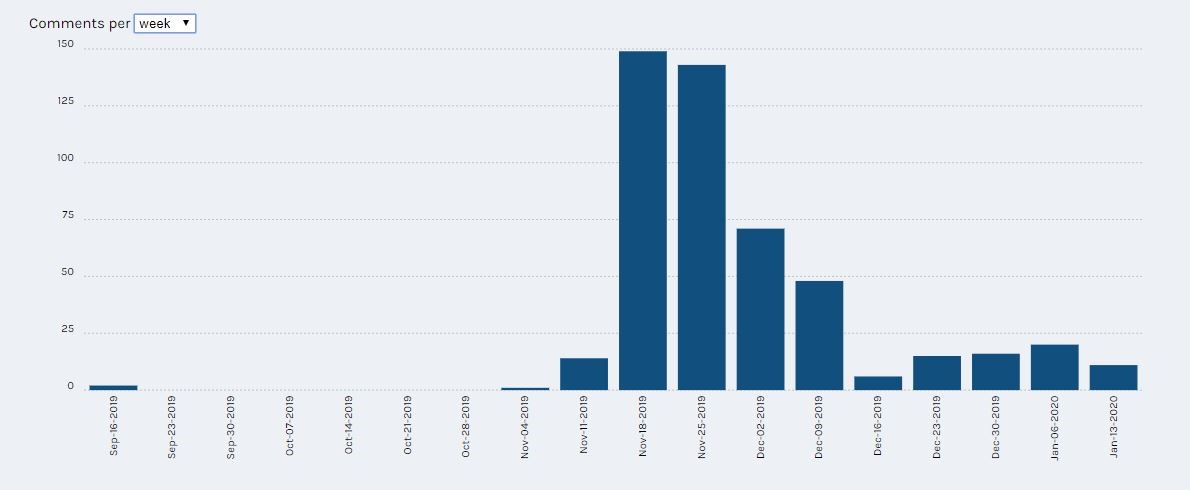
Our online participants additionally have access to the project’s forum, called Talk, where volunteers can speak to one another and to our research team, and we saw exciting data for how many of them were engaging. From November to January, we have had just shy of 500 comments on the Talk boards, many of which raised questions and thoughts, or provided suggestions for changes or additions to the workflow, field guides, or help text.
The Talk board has provided a place for engaging conversations, and for the diverse dialogue we hoped this project might encourage. We have seen participants question the Islamic depictions of familiar constellations, and after conversing with our Curator, express interest in seeing more from the Adler’s collection of Islamic art. We have similarly seen participants adding alternative names to constellations in the comments, and a series of hashtags (#) have been added to create searchability within the community.
Our hope is to begin utilizing this Talk board and community to better engage with the public. We are looking to create blog content, and add additional objects we hope will continue to diversify our collections representation, and encourage dialogue amongst an international community on the importance of constellations within their individual communities.
Conclusion
The purpose of this article is to give insight into the process of designing and prototyping a crowdsourcing project for use within museum exhibits as well as on an online platform with engagement and representation of collections in mind. We highlight the tools available through the Zooniverse Project Builder, but also focus on the importance of in-person testing and using guest feedback to refine workflow design.
We hope that the discussion of the development and prototyping process will shed light on the importance of iterative design thinking and incorporating guest feedback, and help other teams who may wish to include a crowdsourcing project in their museum space see the positive effects they have on engagement both onsite and online.
Acknowledgments
This article is designed as a follow up to a previously published article in the Museums and the Web 2019 Conference Papers, “Crowdsourcing Knowledge: Interactive Learning with Mapping Historic Skies,” written by BrodeFrank, Blickhan, and Rother. This article also uses data generated by the Zooniverse platform, development of which is funded by generous support including a Global Impact Award from Google and a grant from the Alfred P. Sloan Foundation. We acknowledge the Zooniverse web development team based at the Adler Planetarium in Chicago and the University of Oxford, the international research teams who lead Zooniverse projects, and the worldwide community of Zooniverse volunteers, without whom none of this would be possible.
List of Figures
Figure 1: Image taken from the Adler’s Collection of 32 plates from Sidney Hall, Urania’s mirror: or, A view of the heavens, plate 24. Published by Samuel Leigh, 1825.
Figure 2: Zooniverse iPad app.
Figure 3: Zooniverse iPad app “Museum Mode.”
Figure 4: “Classified” constellations from Figure 1 as they would appear after going through the segmentation workflow and the identification workflow.
Figure 5: In Exhibit Workflow Statistics from the weeks of August 5, 2019, to January 13, 2020.
Figure 6: Online Identification Workflow Statistics from the weeks of August 5, 2019, to January 13, 2020.
Figure 7: Online Talk Board Statistics of comments per week from the weeks of September 16, 2019, to January 13, 2020.
Notes
[1] apps.apple.com/us/app/zooniverse/id1194130243
play.google.com/store/apps/details?id=com.zooniversemobile&hl=en_US
[2] Lintott et. al., “Galaxy Zoo,” 2008.
[3] https://www.zooniverse.org/about
[4] https://www.zooniverse.org/about/publications
[5] https://www.zooniverse.org/lab
[6] Trouille et al., “DIY Zooniverse citizen science project,” 2017.
[7] Adler, “Speech at Adler Planetarium,” 1930.
[8] Raposo, “Digital Historic Skies,” 2016.
[9] http://microplants.fieldmuseum.org/
[10] von Konrat et al., “Using citizen science,” 2018.
[11] Cavalier, “Announcing the SciStarter kiosk interface,” 2012.
References
Adler, M. “Speech at Adler Planetarium and Astronomical Museum Dedication.” Speech. The Adler Planetarium, Chicago, Illinois. May 30, 1930.
Blickhan, BrodeFrank, and Rother. “Crowdsourcing Knowledge: Interactive Learning with Mapping Historic Skies.” MuseWeb2019. https://mw19.mwconf.org/paper/crowdsourcing-knowledge-interactive-learning-with-mapping-historic-skies/
Cavalier, D. “Announcing the SciStarter kiosk interface for schools, museums and public areas.” SciStarter blog: Citizen Science Projects, People, and Perspectives. Published December 13, 2012. Accessed January 8, 2019. https://blog.scistarter.com/2012/12/announcing-the-scistarter-kiosk-interface-for-schools-museums-and-public-areas/
von Konrat, M., T. Campbell, B. Carter, M. Grief, M. Bryson, J. Larrain, L. Trouille, et al. “Using citizen science to bridge taxonomic discovery with education and outreach.” Applications in Plant Sciences 6, 2 (2018): e1023. Accessed January 8, 2019. doi:10.1002/aps3.1023.
Lintott, C., K. Schawinski, A. Slosar, K. Land, S. Bamford, D. Thomas, J. Raddick, R.C. Nichol, A. Szalay, D. Andreescu, P. Murray, L. van den Berg. “Galaxy Zoo: morphologies derived from visual inspection of galaxies from the Sloan Digital Sky Survey.” Monthly Notices of the Royal Astronomical Society 389, 3 (2008), 1179-89.
“Microplants Project.” Field Museum. Accessed January 10, 2020, http://microplants.fieldmuseum.org/
Raposo, P. “Digital Historic Skies.” 2016. https://doi.org/10.17613/m6jh21
Trouille, L., C. Lintott, G. Miller, H. Spiers. “DIY Zooniverse citizen science project: engaging the public with your museum’s collections and data.” MW17: MW 2017. January 30, 2017. Accessed January 8, 2019. https://mw17.mwconf.org/paper/diy-your-own-zooniverse-citizen-science-project-engaging-the-public-with-your-museums-collections-and-data/
Zooniverse Website.
– “Build a Project.” Zooniverse. Accessed January 10, 2020. https://www.zooniverse.org/lab
– “About.” Zooniverse. Accessed January 10, 2020. https://www.zooniverse.org/about
– “Publications.” Zooniverse. Accessed January 10, 2020. https://www.zooniverse.org/about/publications